Recent Research
Research Centered Around Marathon Data
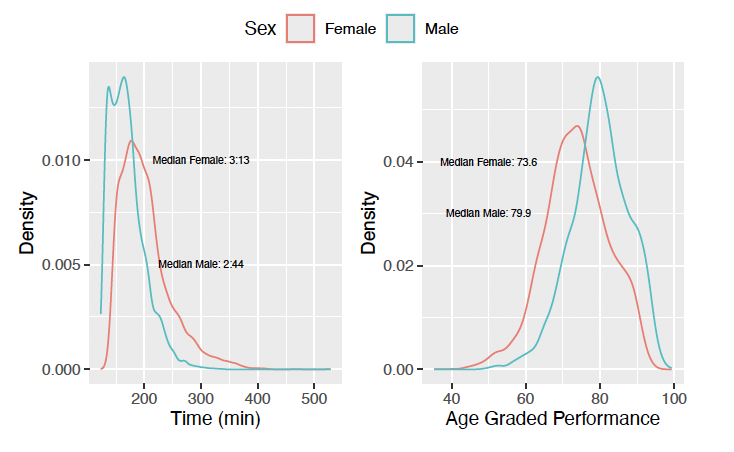
Running race results are publicly available including time, age, and gender. This data, combined with weather and pollution data, can be used to answer various research questions. Recent students have analyzed how weather impacts running performance by age and gender, the impact of Title IX on the trajectory of female running performance, and whether there exists a gender bias in existing age-grade standards.
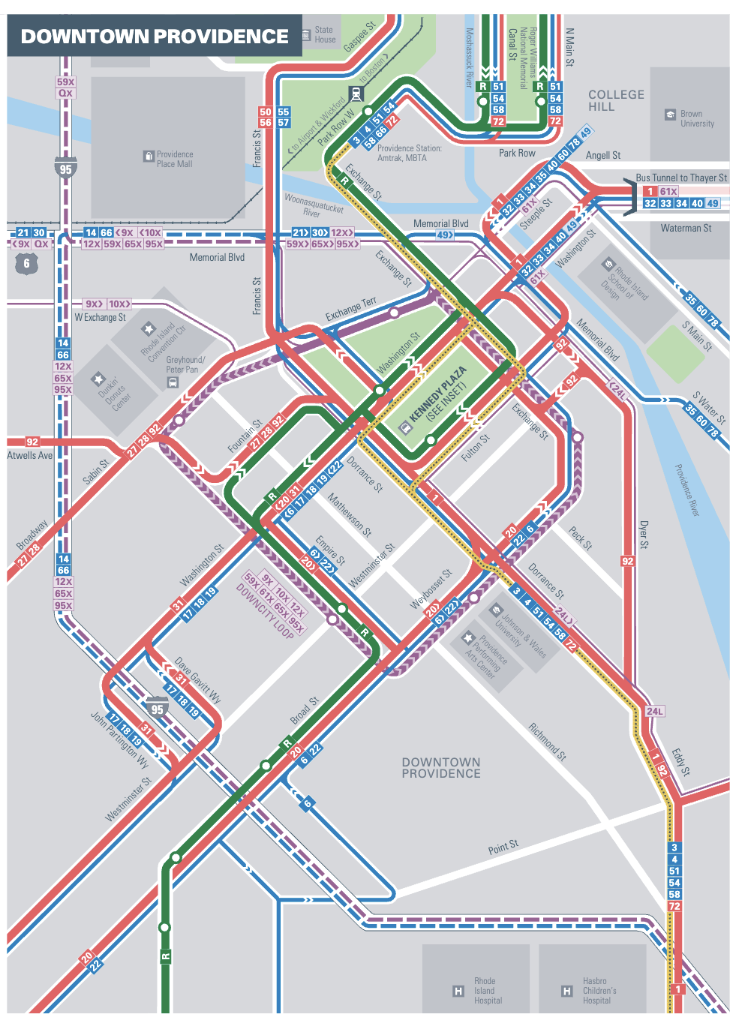
Prescriptive Analytics for RIPTA Ridership
The Rhode Island Public Transit Authority (RIPTA) is the primary transit service within Rhode Island. The planning, scheduling, and data analysis teams within RIPTA use past ridership data to drive future operational decisions. This project uses this data to help support RIPTA's mission of providing reliable and cost-effective service across the community.
One part of this research will examine the impact of the Washington Bridge closure on ridership and service levels. Since the closure, traffic in and around East Providence has increased substantially. This not only impacts routes that need to cross the bridge but also those servicing the surrounding regions. Our goal will be to use ridership data before and after the closure to estimate the impact on ridership by route and service delays. Given the bridge will be closed for at least the next two years, this information can then be used to analyze whether schedule or service changes would help to increase ridership and on-time performance.
The second aim of this research is to work with RIPTA to develop a data-driven way to maximize service under resource constraints. To do so, we can use past ridership data, past survey data, and travel times as input into a model of demand throughout the state. Modeling this complex system will require a combination of simulation and optimization techniques as well as an iterative modeling process to build in this underlying complexity. A key objective will also be to make this decision-making tool transparent and explainable to the public.
Risk Score Optimization
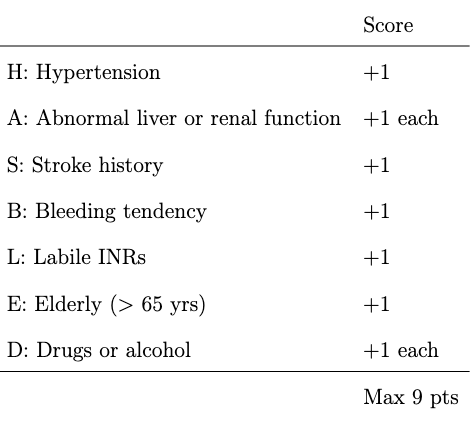
Integer risk score models play a crucial role in healthcare by enabling clinicians to quickly estimate risk and giving a highly interpretable output. For example, the HAS-BLED risk score model (below) estimates the 1-year risk of major bleeding in patients with atrial fibrillation [Pisters et al., 2010]. Risk score models can be found by rounding the estimated coefficients from a logistic regression model. However, rounding can significantly reduce the performance. Recent work has aimed to directly solve for a maximum likelihood risk score model. We introduce a new cyclical coordinate descent algorithm to estimate integer risk score models that scales well with the number of observations and covariates. We highlight our method with two applications in tuberculosis (TB) research to demonstrate how solving for an optimal risk score model can impact the model's performance and output. Our algorithm is implemented in an accessible R package.
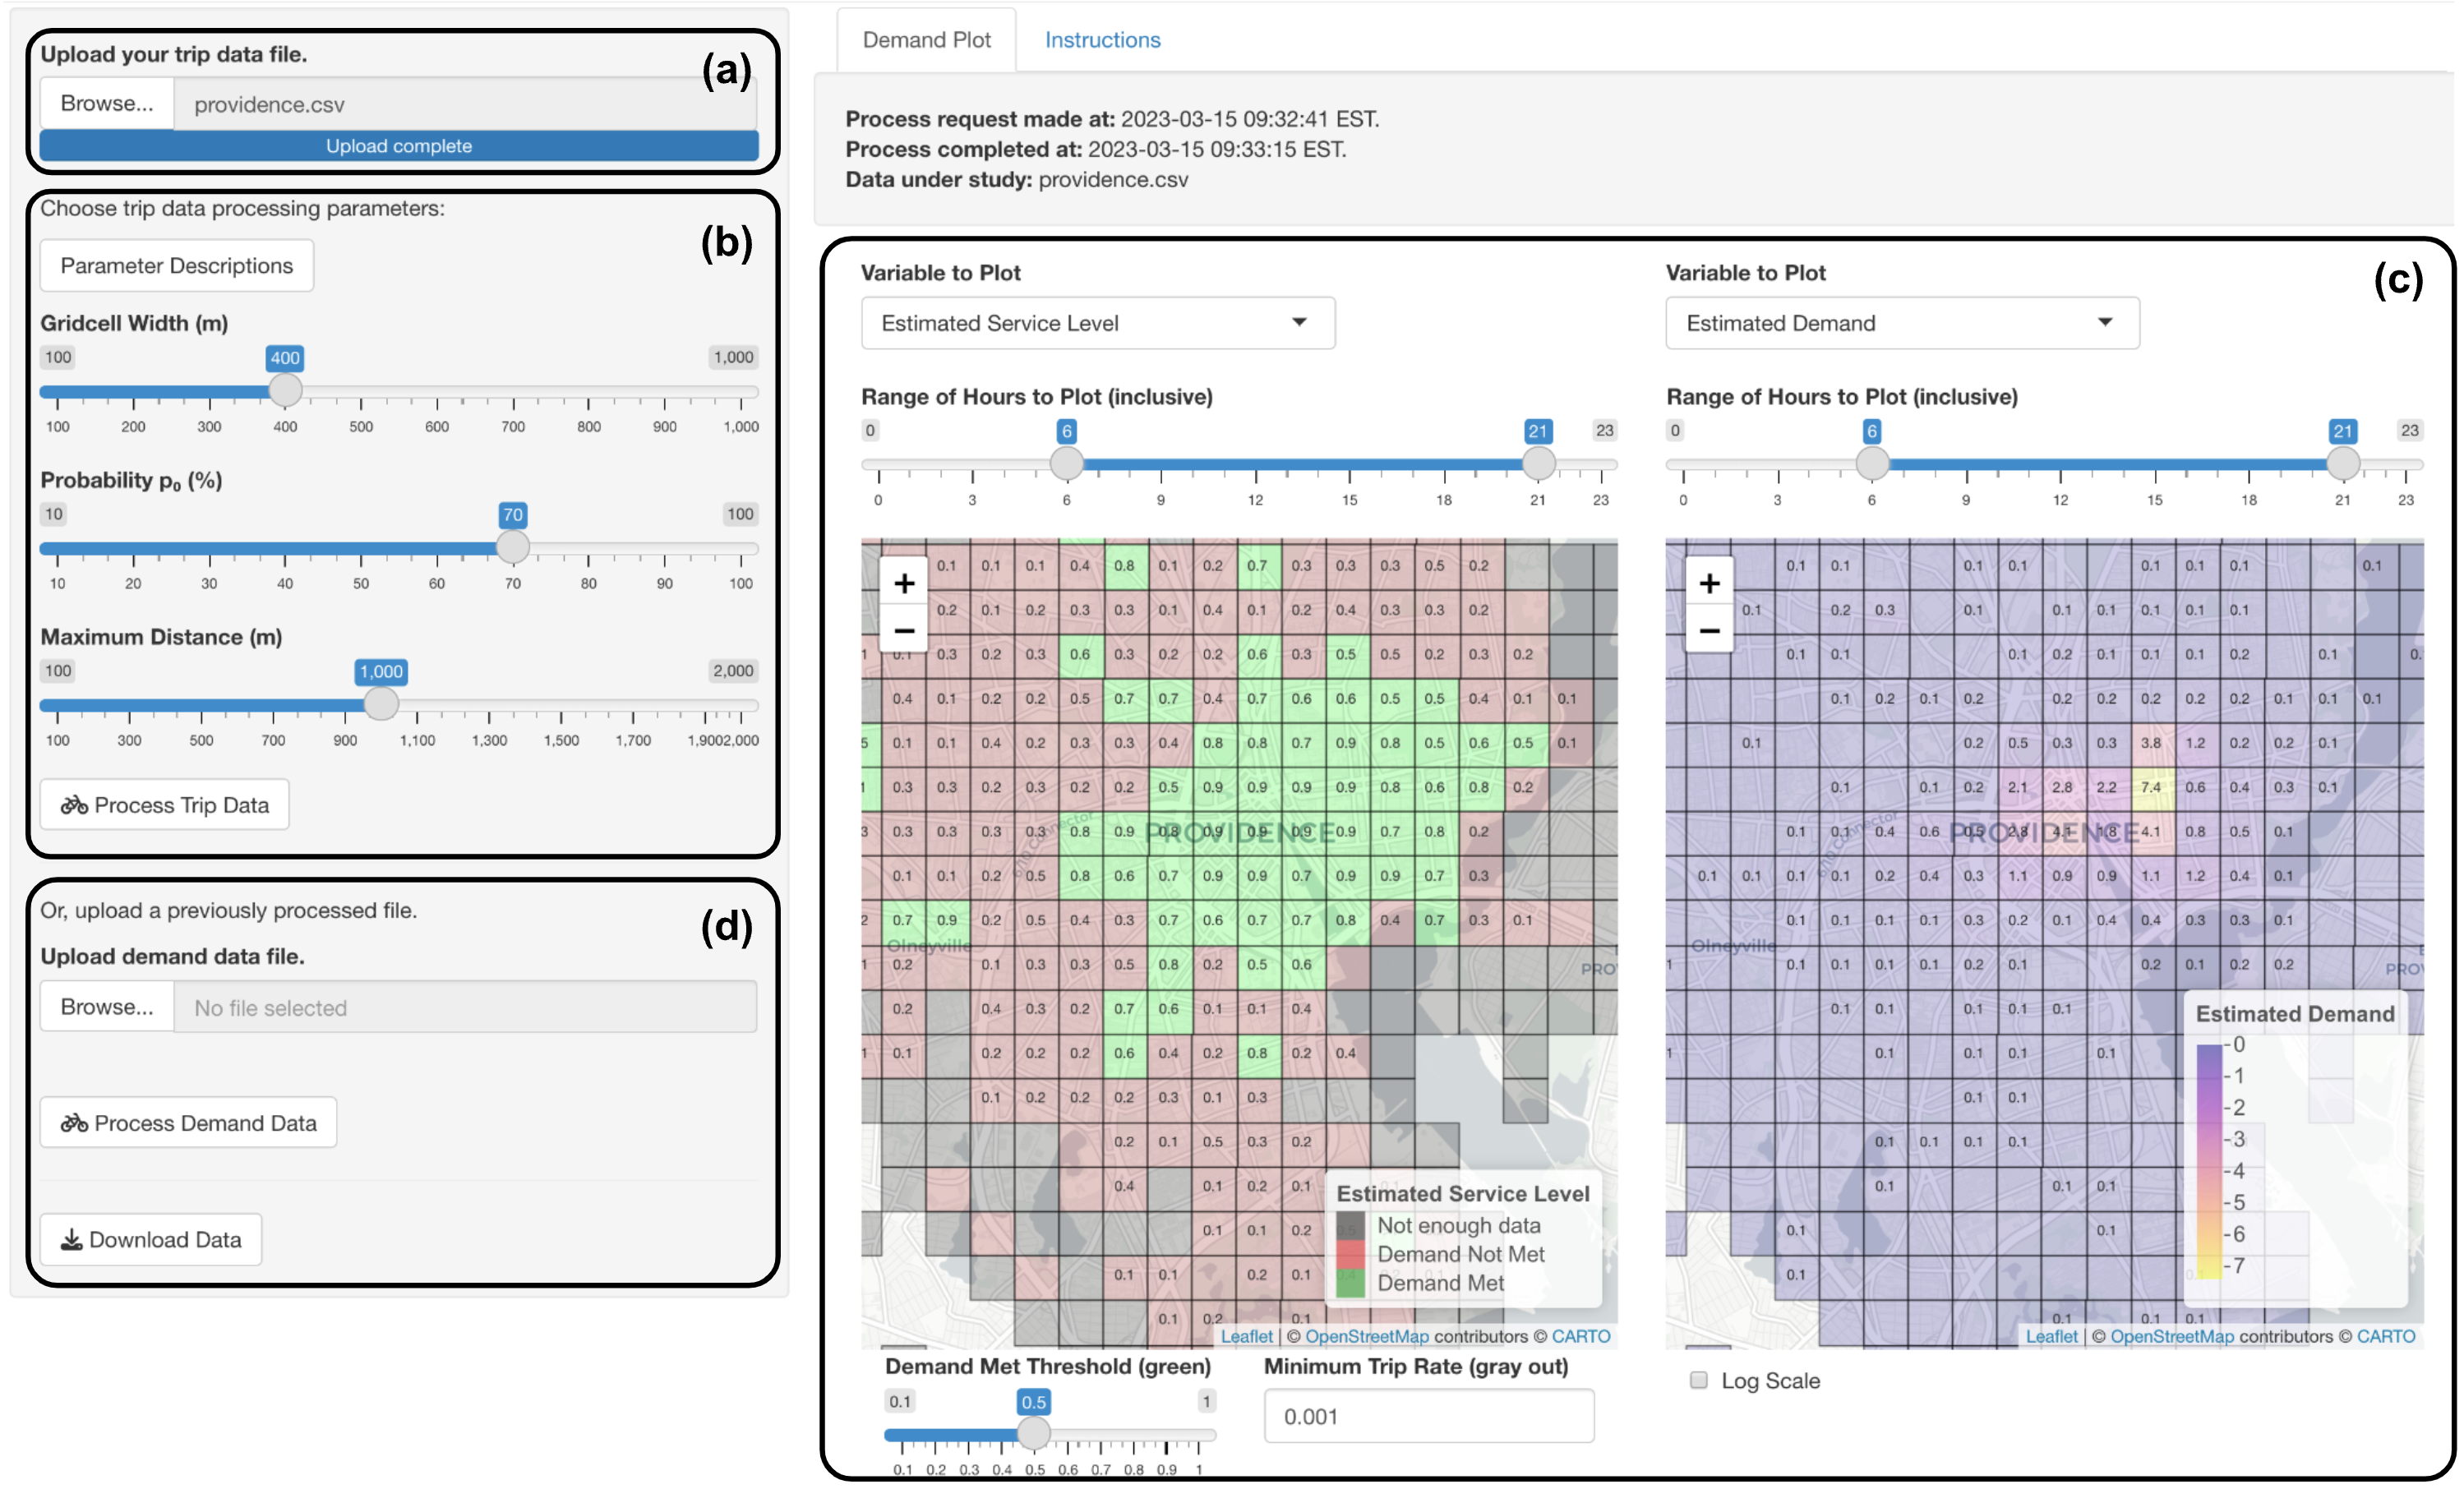
Estimating Censored Demand in Dockless Shared Micromobility
In shared micromobility networks, such as bike-share and scooter-share networks, using trip data to accurately estimate demand in docked and dockless systems is critical to analyzing how the system is operating, such as identifying the number of dissatisfied users, operational costs, and equity in access, especially for city officials. However, the distribution of available bikes affects the distribution of observed trips. Users may walk from an unobserved cell location to an available bike masking the true location of user demand, and users may look for a bike and not find one, which is unobserved user demand. We present a flexible and interpretable framework to estimate spatial-temporal demand as a spatial non-homogeneous Poisson process that explicitly models how users choose a bike, bridging the gap between the docked and dockless methodology.
We designed our model in collaboration with city planners from the City of Providence and apply our algorithm on data from Providence's dockless scooter-share network. The results give insights into how the city can better ensure equitable access throughout the city. Our estimation algorithm is available through an efficient and user-friendly application designed for other city planners and organizations to help inform system planning.